
Blog Training
The 6 Best Swing Indicators in Stock Market
Dec
Swing Trading: A Preferred Trading Style for Beginners and Experts Alike. Among the various trading styles like day trading and position trading, swing trading emerges as a highly favored approach. This style is particularly appealing for beginners due to its less demanding and more relaxed nature compared to day trading, yet it still offers ample opportunities for traders to benefit from market price movements.
Essential Swing Trading Indicators for Effective Trading Decisions. Swing traders often rely on critical swing trading indicators. These indicators are vital for identifying key support and resistance levels as market trends shift, thus presenting valuable trading chances. Utilizing a combination of technical indicators is generally recommended to accurately ascertain a market trend before making a trading move. This is because relying on a single indicator might lead to inaccuracies, making additional verification a necessary step.
Introduction to Cryptocurrency Swing Trading with Top Technical Indicators. In this article, we explore the intriguing world of cryptocurrency swing trading. We’ll guide you through some of the most effective technical indicators that are essential for beginners looking to venture into this aspect of trading, ensuring a well-informed start in the rapidly evolving cryptocurrency market.
What is Swing Trading?
Swing trading is a strategic approach where a trader initiates positions based on anticipated price movements, aiming to capture gains when the market trends as expected. Unlike day trading, swing trading involves holding positions overnight, and these can extend for several days or even weeks.
Understanding the Core of Swing Trading in Cryptocurrency. The foundation of swing trading lies in leveraging price retracements, a frequent occurrence in the cryptocurrency market. These price movements, known as swings, are the primary focus of swing traders who seek to capitalize on these fluctuations to enter trades and garner profits. While some swings might be minor, yielding smaller profits, the consistency in executing trades can lead to substantial cumulative gains over time. Technical indicators play a crucial role in aiding swing traders to pinpoint optimal entry and exit points.
Innovative Trading Methods and Indicators in Swing Trading. Swing trading commonly utilizes a key tool known as Bollinger Bands®, which plots a set of standard deviations around a moving average. Alternatively, some traders opt for the average true range indicator to gauge market volatility in the crypto sphere. Ultimately, integrating various swing trading indicators is crucial for a comprehensive understanding and accurate prediction of cryptocurrency price movements, thereby enhancing trading decisions.
How Swing Trading Works: An Overview
Before delving into the top technical indicators used in swing trading, it’s important to understand the basics of how a swing trade operates.
Swing trading is a method where traders maintain their position for an extended period, ranging from several days to weeks. This approach hinges on the continuation of a market trend aligning with the trader’s initial prediction. Swing traders typically opt to close their positions when there are indications of a trend reversal. Unlike day traders who focus on short-term price fluctuations, swing traders are not concerned with minor market volatilities. Their primary interest lies in the broader market movement: in a bullish market, they look for swing highs to progressively rise, and in a bearish market, they expect swing lows to consistently drop.
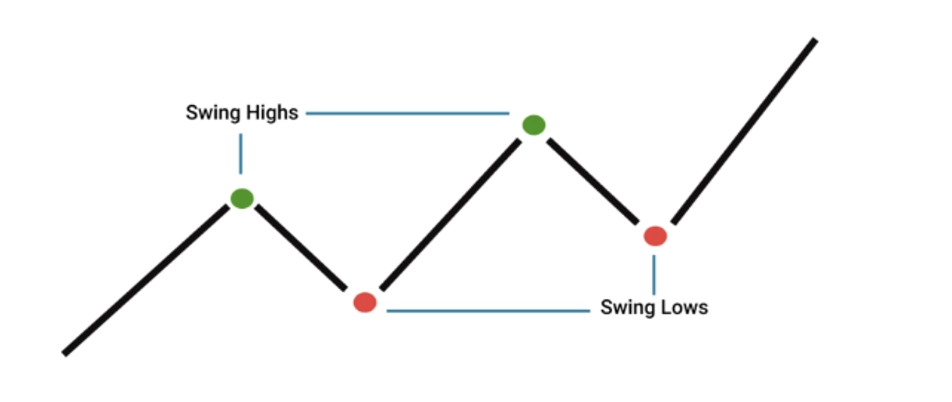
Swing High
Swing highs are consecutive peaks touched by a cryptocurrency’s price before fleeting moments of retracement. Sometimes the retracement can turn into a trend reversal, which breaks the consecutive swing highs. A current high that’s higher than the previous peaks can be identified as an uptrend.
Swing Low
Swing lows are consecutive lows made after the temporary moments of rebounds. When the current low is lower than the previous ones, we can determine a generally bearish trend.
Some swing traders prefer to trade between swing highs and lows only, which usually becomes a shorter-term version of swing trading.
Swing Trading Indicators
Swing trading indicators use mathematical calculations to determine various aspects of a price action based on historical data. They can be implemented on a daily chart, or with any other time frames used by swing traders to assess the market situation.
These indicators help traders determine whether a trend is bullish or bearish and whether it has momentum. While some swing traders rely more on news and fundamental analysis, technical indicators are imperative to determine the best entry and exit points.
The three most important types of swing trading indicators are as follows:
- Trend indicators — These indicate the market’s direction, and whether a trend can be established. Generally, trend indicators are used to smooth out price volatility in order to highlight the primary trend. Moving averages are the most well-known trend indicators.
- Momentum indicators — Momentum indicators show how strong a trend is and whether a reversal might be on the horizon. They can also indicate overbought or oversold levels. The most commonly used momentum indicator is the relative strength index (RSI).
- Volume indicators — These indicate how many traders are buying and selling an asset at any given time.
Best Swing Trading Indicators
In this section we’ll cover some of the best swing trading indicators. However, it should be noted that regardless of which indicators are used, it’s almost impossible to guarantee profits. This is because technical indicators are utilizing historical data to predict the future, and there will always be certain inconsistencies that will lead to different outcomes.
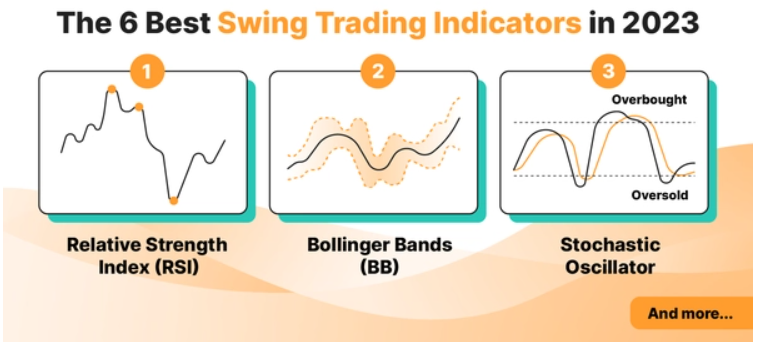
Here are the six most popular technical indicators used in swing trading.
1. Relative Strength Index (RSI)
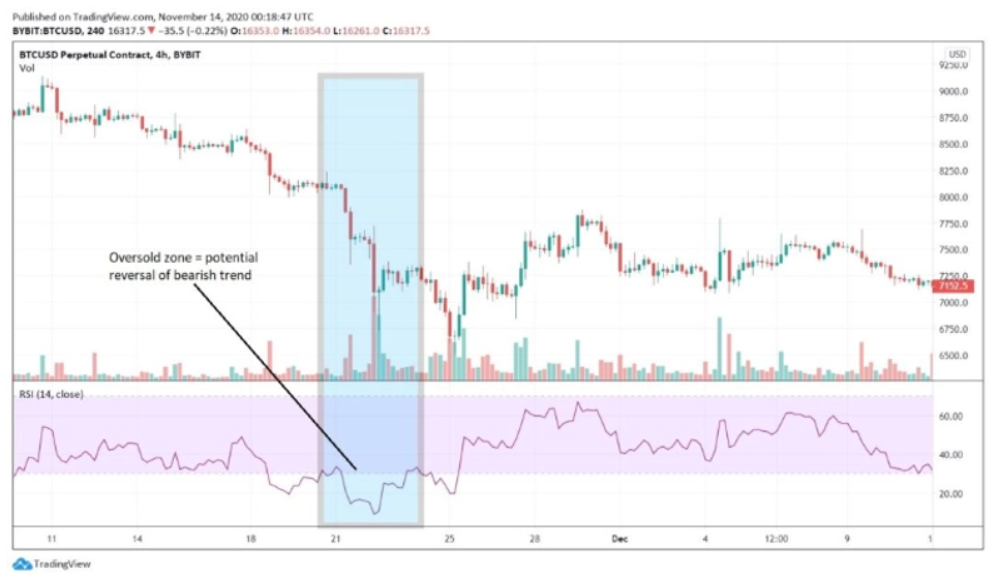
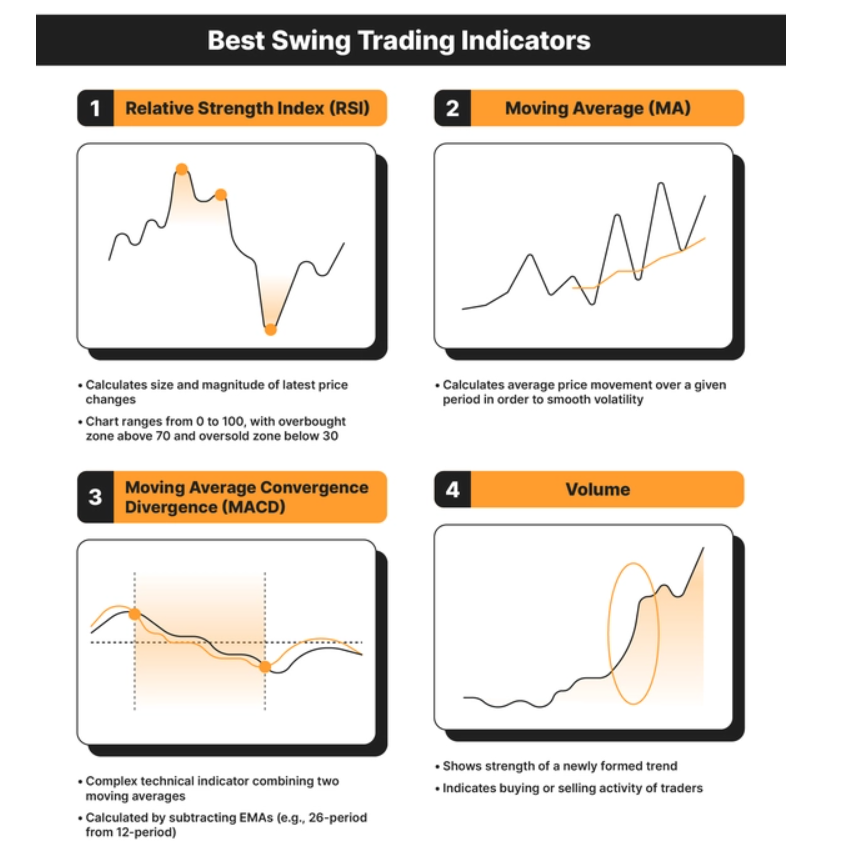
The Relative Strength Index (RSI) stands as a pivotal indicator in cryptocurrency trading, often categorized under ‘oscillators.’ This tool is designed to assess the magnitude and velocity of recent price changes, providing swing traders with critical insights into market conditions. The primary function of the RSI indicator for swing traders is to gauge whether a cryptocurrency is in an overbought or oversold state.
Understanding the RSI Oscillator The RSI is presented as an oscillator, essentially a line graph oscillating between two extreme values, marked from 0 to 100. This graphical representation allows traders to quickly discern the current market state of a cryptocurrency.
Interpreting RSI Signals
- Overbought Condition: When the RSI value exceeds 70, it generally indicates that the cryptocurrency is in an overbought zone. This scenario suggests a possible reversal in the prevailing upward trend, signaling traders to anticipate potential changes.
- Oversold Condition: Conversely, an RSI value falling below 30 signals an oversold market condition. In such cases, traders can expect that the downward trend might soon reach its end.
Using Center Line Crossovers Another strategic use of the RSI is through analyzing center line crossovers. For instance, a crossover above the RSI’s center line can indicate an emerging bullish trend. This method offers an alternative way to interpret market dynamics using the RSI.
2. Moving Average (MA)
The Moving Average (MA) is a widely utilized tool in technical analysis, not just in cryptocurrency trading but also in traditional finance markets for commodities and company shares. It serves as a crucial indicator for swing traders to understand the average price movement of an asset over a specified time frame. By calculating the MA, traders can smooth out short-term volatility, making it easier to identify and follow potential trends.
Key Aspects of Moving Averages
- Lagging Indicator: It’s important to note that MAs are lagging indicators, meaning they are based on past price actions. Therefore, their best use is in confirming existing trends rather than predicting future movements.
- Time Period Variations: MAs can be categorized based on the duration of the lookback period. Short-term MAs typically analyze between 5 and 50 periods, while medium-term MAs extend up to 100 periods.
Types of Moving Averages
- Simple Moving Averages (SMAs): SMAs calculate the average asset price over a specific period in a straightforward manner.
- Exponential Moving Averages (EMAs): EMAs give more emphasis to recent price actions by assigning them greater weight. This feature makes EMAs more responsive to recent market changes.
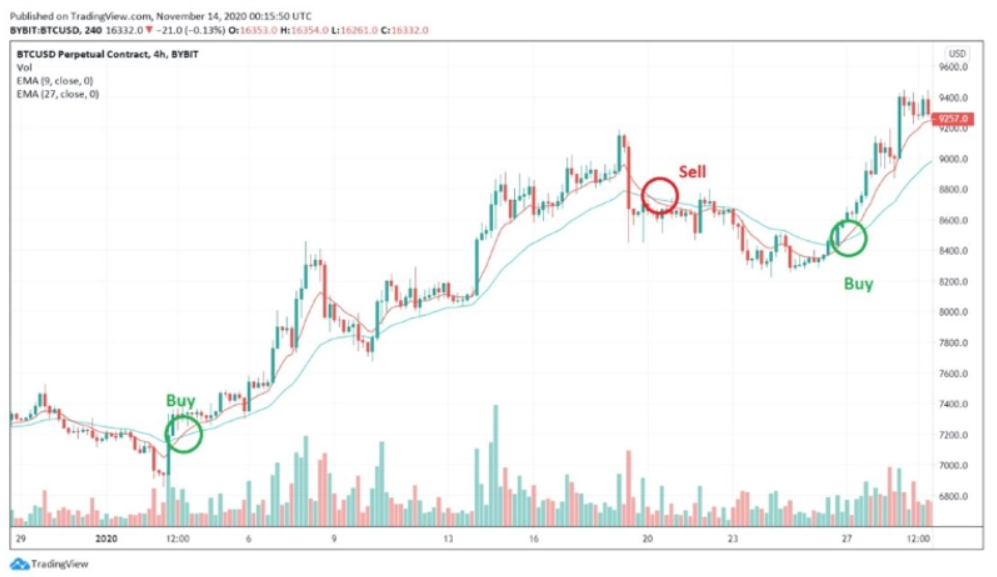
Interpreting MA Signals in Swing Trading
- Bullish Signal: A bullish trend is often indicated when a short-term MA crosses over a longer-term MA. This crossover suggests a potential upward movement in the asset’s price.
- Bearish Signal: Conversely, a bearish signal is identified when a longer-term MA crosses below a short-term MA, warning traders of a possible downtrend.
These indicators, when used correctly, can provide valuable insights for swing traders in both cryptocurrency and traditional financial markets.
3. Moving Average Convergence Divergence (MACD)
")
The Moving Average Convergence Divergence (MACD) is a sophisticated technical indicator that integrates aspects of two moving averages. It’s calculated by subtracting the 26-period Exponential Moving Average (EMA) from the 12-period EMA. Traders often adjust these periods to suit their specific trading strategies. It’s important to note that the two lines shown in the MACD chart are not the actual moving averages used in the calculation. Instead, the MACD comprises three key elements:
- The MACD Line: This line represents the difference between the two selected moving averages.
- The Signal Line: Serving as an indicator of price momentum changes, the signal line is crucial for identifying potential bullish and bearish trading signals.
- The Histogram: This element illustrates the difference between the MACD line and the signal line.
Application of MACD in Swing Trading
- Buying Signals: Swing traders typically consider buying when the MACD line crosses above its signal line. This bullish signal is often marked by green circles in the chart.
- Selling or Shorting Signals: Conversely, a bearish signal for selling or shorting is indicated when the MACD line crosses below the signal line, typically highlighted by red circles.
Advanced Use of MACD: Divergence Analysis Another strategic use of the MACD is to identify divergences between the histogram and the actual price action. This divergence is often a precursor to a potential trend reversal, providing an early warning for traders to adjust their positions accordingly. This advanced technique adds an additional layer of analysis, allowing traders to anticipate changes in market trends.
4. Volume
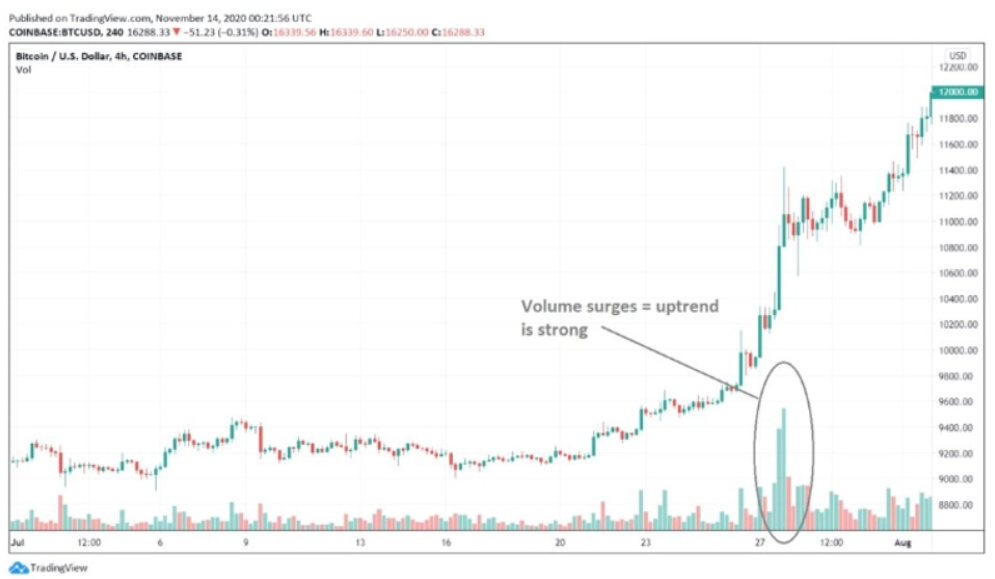
Volume is a crucial indicator for swing traders, though it’s sometimes overlooked by beginners. Typically displayed beneath the main chart, volume provides valuable insights into the strength and robustness of emerging market trends. This indicator essentially reflects the number of traders engaged in buying or selling a cryptocurrency or asset at any given moment. A higher trading volume indicates a stronger and more credible trend, making it a vital aspect of market analysis.
The Importance of Volume in Breakout Strategies Volume becomes particularly significant in breakout strategies. This strategy focuses on moments when an asset’s price moves beyond a defined resistance line (indicating a potential upward trend) or falls below a support line (suggesting a downward trend). The key to confirming the validity of these breakouts lies in the accompanying trading volume:
- High Volume Breakouts: When a breakout occurs with high trading volume, it’s generally seen as a strong signal that the new trend will be substantial and enduring. High volume in such scenarios confirms market consensus and adds legitimacy to the price movement.
In summary, volume is an essential tool in the swing trader’s toolkit, offering crucial insights into market dynamics and assisting in validating trend shifts, especially in breakout scenarios.
5. Bollinger Bands (BB)
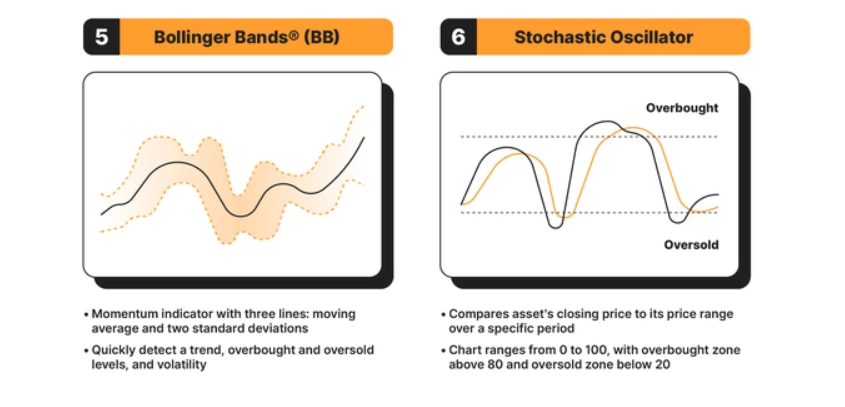
Bollinger Bands® (BB) are a widely used momentum indicator in swing trading, comprising three lines: a central moving average and two standard deviations (one positive and one negative) on either side. This indicator is favored by swing traders for its ability to quickly identify trends, as well as overbought and oversold levels, in addition to measuring market volatility. Moreover, its clarity and visual appeal on trading charts make it a preferred tool.
Key Features of Bollinger Bands®
- Volatility Measurement: The distance between the two bands is directly related to market volatility. When volatility increases, the bands widen, and conversely, they contract during periods of lower volatility. Hence, narrow bands indicate low volatility.
- Trend Identification: The width of the BB can signal the beginning of a new trend. An expansion in the bands often suggests that a new trend is forming.
Effective Use of BB in Different Market Conditions
- Trending Markets: BB are effective in trending markets, helping traders identify potential entry and exit points.
- Ranging Markets: BB particularly excel in ranging markets, where the price oscillates within a horizontal channel. In such scenarios:
- When the price touches the upper band, it often indicates a potential for going short.
- Conversely, when the price reaches the lower band, it may signal a rebound or buying opportunity.
The Central Principle of BB A fundamental aspect of BB is the tendency of prices to gravitate towards the center of the bands. Traders should be cautious when the bands start to widen, as this can indicate the formation of a new trend, necessitating careful consideration before executing trades within that band. This behavior reflects the dynamic nature of markets and the importance of adapting trading strategies to changing conditions.
6. Stochastic Oscillator
Understanding the Stochastic Oscillator in Swing Trading The stochastic oscillator is a momentum indicator in technical analysis, functioning similarly to the Relative Strength Index (RSI) but with its unique calculation method. It compares the closing price of an asset to its price range over a specified time period, offering insights into the asset’s momentum.
Key Features of the Stochastic Oscillator
- Range and Interpretation: Like the RSI, the stochastic oscillator is plotted on a scale from 0 to 100. However, its overbought and oversold thresholds are set differently: above 80 for overbought and below 20 for oversold conditions.
- Two-Line Composition: Unlike the RSI, which is represented by a single line, the stochastic oscillator consists of two lines. The primary line indicates the current value of the oscillator, while the secondary line is a three-day Moving Average (MA) of this value.
Application in Trading
- Identifying Overbought and Oversold Levels: Traders use the stochastic oscillator to gauge whether an asset is in overbought or oversold territory, similar to the RSI.
- Watching for Crossovers: A significant aspect of using the stochastic oscillator is observing when the two lines cross each other. Such crossovers are often considered as signals of potential trend reversals.
The stochastic oscillator, with its dual-line structure and specific thresholds for overbought and oversold conditions, provides traders with a nuanced tool for assessing market momentum and predicting shifts in asset trends.
Best Swing Trading Tools to Use
The trading indicators described above can be great tools when it comes to providing relevant signals, but they become even more efficient if you combine them with other chart tools. Here are some suggestions.
Support and Resistance Lines
A swing trader needs to always pay attention to support and resistancelevels that a cryptocurrency’s price has had difficulties breaking.
In short, a resistance level is an imaginary upper line that a price fails to break (usually falling upon touching the resistance). On the other hand, a support level is an imaginary line made of recent lows, at which a price typically stops declining and rebounds upward.
Chart Patterns
Swing traders can also look for chart patterns, usually observed on candlestick charts. There are two main categories of patterns:
Trend continuation patterns, which anticipate the continuation of a trend; some examples are triangles, rectangles, flags, and pennants
Trend reversal patterns, which signal the reversal of a trend; some examples are double tops or bottoms, and head and shoulders
Final Considerations on Swing Trading for Beginners
Swing trading presents itself as a potentially ideal trading style for beginners, offering a balanced approach between the rapid pace of day trading and the long-term commitment of position trading. The use of trading indicators in this style can be particularly advantageous in capitalizing on market volatility.
Key Takeaways:
- Embrace Risk Management: Despite the relatively moderate pace of price movements in swing trading, it’s crucial not to overlook essential risk management strategies. Implementing stop-loss orders is a fundamental practice that can safeguard your investment from significant losses.
- Realistic Expectations from Indicators: While trading indicators are invaluable tools, they have their limitations. They are not infallible predictors of future market movements. Instead, their primary function is to aid in making more informed decisions by providing insights based on market analysis and historical trends.
- Balanced Approach: Swing trading strikes a balance in trading dynamics, making it a suitable option for those new to trading. It allows traders to benefit from price changes without the intense pressure of day trading or the long-term uncertainty of position trading.
In conclusion, swing trading, with its strategic use of trading indicators and emphasis on risk management, offers a comprehensive approach for beginners. It’s essential to remember that these indicators are guides, not guarantees. They should be used as part of a broader strategy that includes market analysis, pattern recognition, and a solid understanding of risk management to navigate the complexities of the financial markets effectively.